What we work with

Business intelligence

Leaders need figures they can trust, when they need them. We bring data from your systems into one governed store, check it, and present it in dashboards built around the decisions each person makes.

What we build

  • Data warehouses that combine records from several systems
  • ETL and ELT pipelines with scheduled refresh and failure alerts
  • Dashboards in Power BI or Metabase, designed for a specific decision
  • Automated reports sent in the formats each stakeholder requires
  • Data quality checks that flag missing, duplicate or out-of-range values

How we deliver

  1. 01

    Agree the decisions and the measures behind them before building any chart

  2. 02

    Build the pipelines and checks, then reconcile figures against source records

  3. 03

    Train users on the dashboards and hand over ownership

Tools and standards

  • Data warehousing
  • ETL and ELT
  • Power BI
  • Metabase
  • Data quality checks

Case studies

Where we have used it.

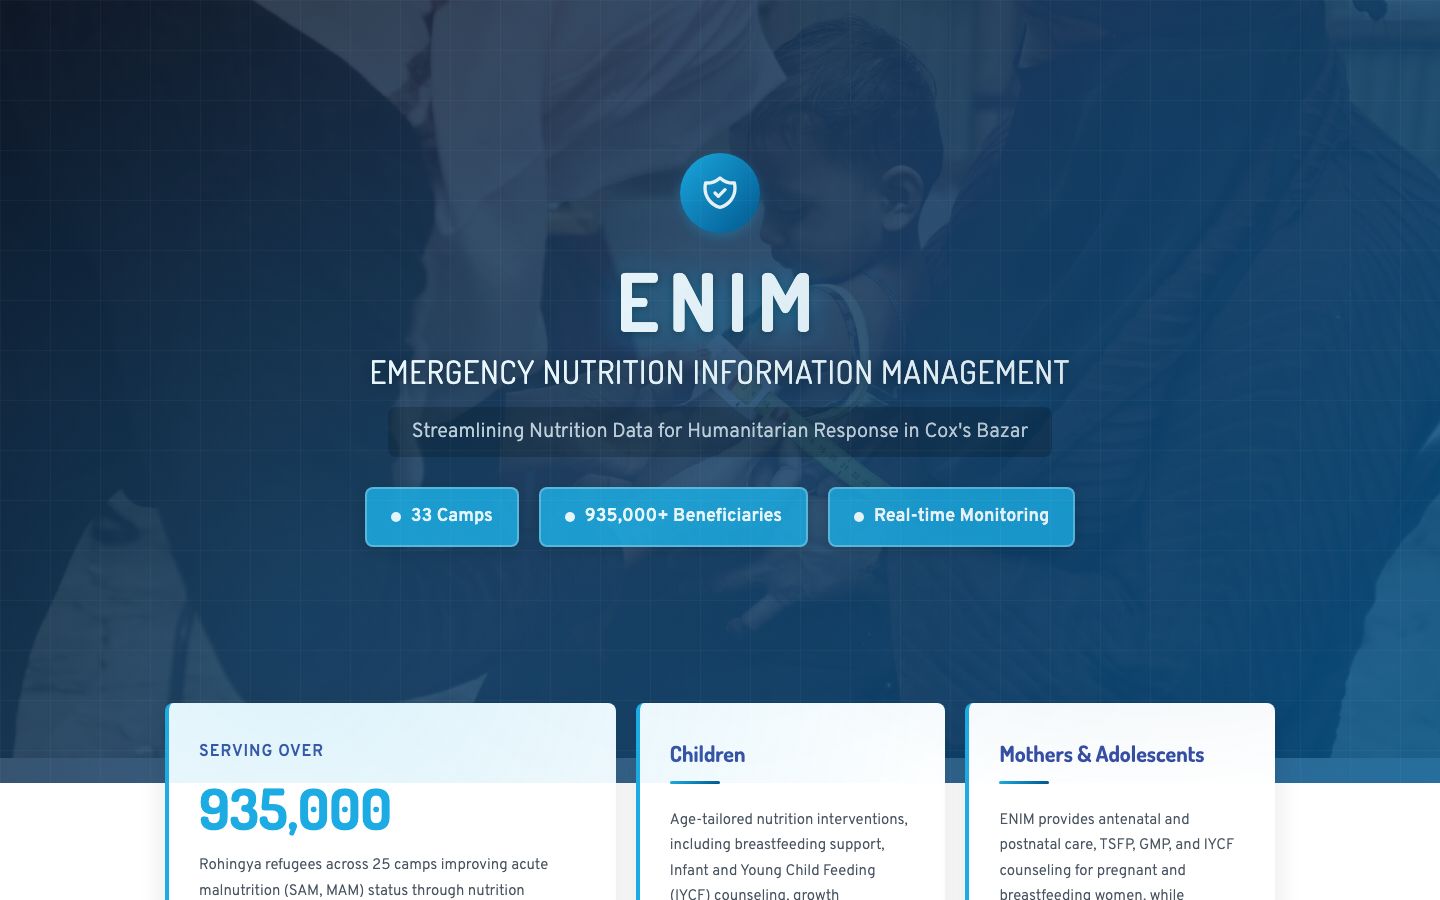
  • Screenshot of ENIM
    Humanitarian responseLive

    ENIM

    UNICEF and the Nutrition Sector, Cox's Bazar

    The nutrition information system for the Rohingya response in Cox's Bazar: one case-based record for more than 935,000 people across 33 camps, with real-time monitoring.

    Read the case study: ENIM →
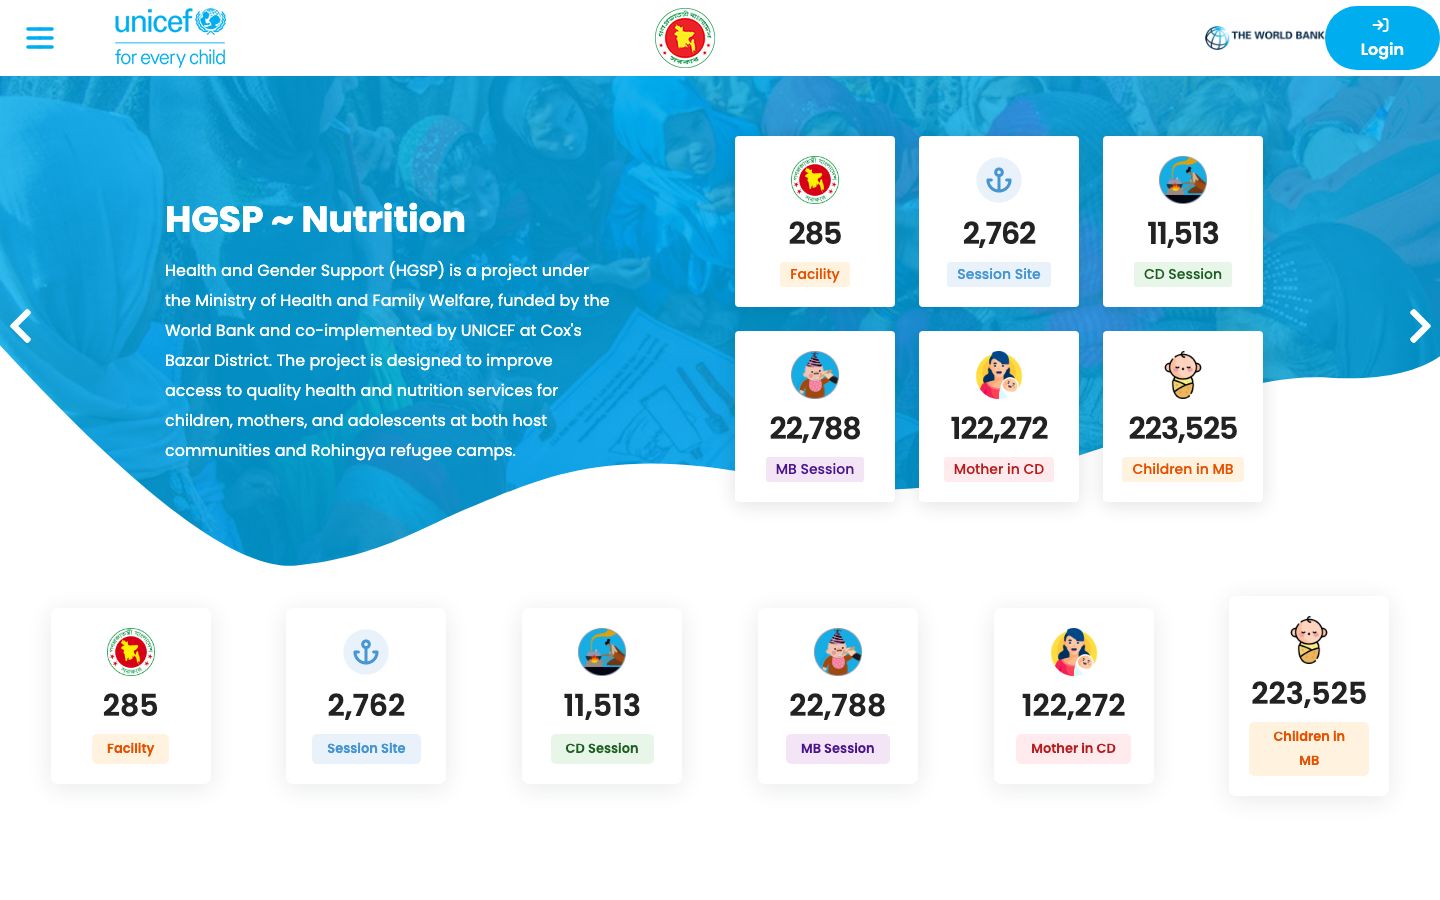
  • Screenshot of HGSP Monitoring
    Primary healthDelivered

    HGSP Monitoring

    UNICEF Bangladesh, for the HGSP nutrition programme

    A web dashboard and mobile app that monitored nutrition sessions at community facilities across Cox's Bazar district, online and offline, for a Ministry of Health and Family Welfare programme co-implemented by UNICEF.

    Read the case study: HGSP Monitoring →

Questions

Questions about business intelligence.

Which BI tools do you use?

Power BI and Metabase for dashboards, on top of a data warehouse fed by ETL or ELT pipelines with scheduled refresh.

How do you make sure the figures are right?

Data quality checks flag missing, duplicate or out-of-range values, and we reconcile dashboard figures against source records before handover.

Can dashboards replace monthly reports?

Yes. Dashboards show live figures for leaders, and automated reports go to each stakeholder in the format they need.

Next step

Let’s solve it together.

Describe the problem in a few lines. We agree a short call before we propose anything.

  1. 01You describe the problem in a few lines.
  2. 02We reply with questions within one business day.
  3. 03We agree a short call before any proposal.
Head office
Suite B1, 60, Road 9/A, Dhanmondi, Dhaka 1209